

A table or figure should make a result relevant to your research question understandable. Provide a clear label, descriptive title, units and data provenance, then explain the important finding in the text. State the denominator and response count for percentages. Follow the required style and institutional guidance for exact placement and formatting.
When should you use a table or a chart?
Use a table for exact values or several related measures. Use a suitable chart to reveal a comparison or pattern. Avoid repeating identical information in a table, chart and a long sentence without a reason for each presentation.
All data below were created for illustration; no survey was conducted. The model has 40 valid answers to one single-choice question about a preferred consultation format.
What does a clear table include?
Table 1
Preferred Consultation Format in Illustrative Data
| Preferred format | Responses | Share |
|---|---|---|
| Daytime appointment | 12 | 30 % |
| Evening appointment | 18 | 45 % |
| Online appointment | 10 | 25 % |
Note. Illustrative data; n = 40; one answer per person. No research was conducted. Shares equal each count divided by 40 and multiplied by 100. They total 100% because each answer belongs to one category.
This example demonstrates labels and content. The website table uses the website’s styling rather than exact APA typesetting. For an APA 7 document, consult Table setup: number and title above the table, necessary notes below. Do not copy the website borders as an APA requirement.
How should you label a figure?
Figure 1
Shares of Preferred Consultation Formats in Illustrative Data
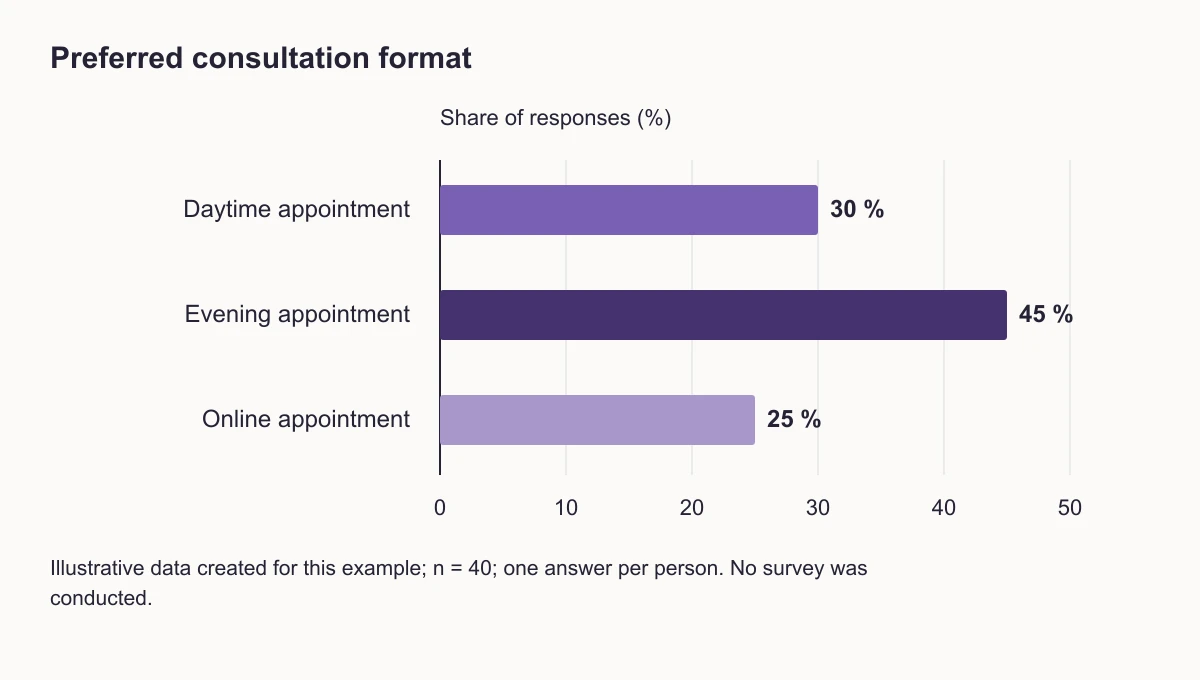
Illustrative data created for this example; n = 40; one answer per person. No survey was conducted.
Categories and percentage units are explicit, bars start at zero and values appear at their ends. Readers need not rely on colour alone. Check legibility in greyscale and after PDF export. APA’s figure guidance treats charts as figures; another institutional system may use a separate chart label.
How do you interpret the result?
A suitable model sentence is: “In these illustrative responses, evening appointments have the largest share, 45% (18 of 40). The comparison describes the created group’s preference; it does not establish an effect on academic performance.”
The sentence identifies a pattern and its limit. Do not call the created answers real students or a representative sample. With actual data, distinguish description from a statistical test. A taller bar alone proves neither statistical significance nor causation. The results phrasebank supports language, not the validity of your conclusions.
How do you attribute sources and handle percentages?
Describe your own data collection in the methods. For reused or adapted data, identify the original source and explain your calculations. “Own processing” alone does not disclose the provenance of someone else’s numbers. Check licences and permission requirements when reusing an existing image, following the applicable citation style.
State whether percentages use all participants or only valid answers. Multiple-response questions can exceed 100% when shares are based on respondents; explain that denominator. Do not turn missing values into measured zeros. When comparing unequal groups, provide an appropriate base rather than only counts. Cite each display in the text. The CSV contains exactly the illustrative counts and percentages shown here.
FAQ
Does every table need a chart?
No. Choose a display for its purpose and avoid unnecessary duplication.
Is “own processing” enough attribution?
For external data, also identify the original source and explain adaptations under the required style.
Must percentages total 100%?
For one choice with a shared denominator, usually yes apart from rounding. Multiple responses need a different explanation.
Are these numbers survey findings?
No. They form a created 40-response example for teaching presentation and interpretation.
Downloadable worksheet
Related guides
- Case Study Research for Your Dissertation: Design, Structure and Worked Example
- Thematic Analysis of Interviews: From Transcripts to Codes and Themes
- Dissertation Aims and Objectives: How to Write Them with Examples
- APA 7: How to Cite a Book, Journal Article and Website, with Examples
- How to Analyze Survey Data in Excel: Steps, Charts and PivotTables